.png)
Monitoring the performance of the Appliance
Overview
To keep track of the hardware and network resources consumed during their operation, Nexthink Appliances internally run collectd.
The collectd daemon gathers the following performance metrics by default:
aggregation: Sum and average of the usage over all CPUs.
cpu: Amount of time spent by the CPU in various states; namely executing user code, executing system code, waiting for IO-operations and being idle.
df: File system usage information; basically how much space on a mounted partition is used and how much is available. Named after the df(1) UNIX command and very similar to it.
disk: Performance statistics of hard-disks and, where supported, partitions.
interface: Information about the traffic (bytes, packets and errors per second) of interfaces.
load: System load. Rough overview over the usage of a machine.
memory: Physical memory usage as reported by the operating system.
ntpd: Drifts of the ntpd daemon from the reference NTP server.
processes: Process-related information about the Engine and the Portal.
swap: Swap usage.
vmem: Virtual memory usage.
Getting performance data
To get the RRD files generated by collectd:
Log in to the Web Console of the Appliance to monitor (Portal or Engine).
Select the APPLIANCE tab at the top of the Web Console.
Click Monitoring on the left-hand side menu.
Find the Performance data section:
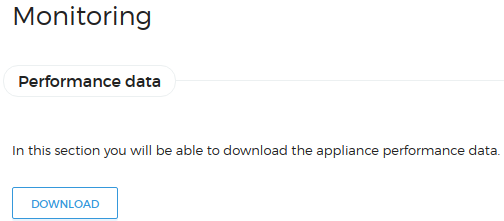
Click DOWNLOAD. Your web browser downloads a compressed tape archive file (tar.gz extension) that holds the collectd performance data and includes the current date and time in its name.
RELATED REFERENCE